This was originally a final project in Linear Algebra at Quest University completed with my classmates, Casey Lake and Edward Zuo, under Dr. Richard Hoshino. The data was obtained in August, 2017. Here, I migrate it from Maple to an Excel/JuMP system for ease of use and updatability.
See my GitHub for the Excel sheet and full Julia code.
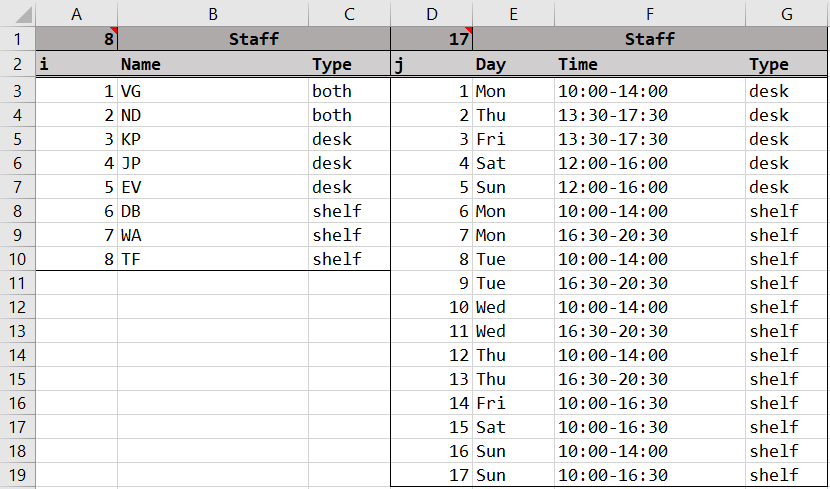
The Squamish Public Library has eight part-time employees who must cover seventeen different shifts throughout the week. These library shifts are classified into two types: shelving shifts and circulation (desk) shifts. Certain employees can only work certain shifts. We refer to these employees by their initials:
We have an Excel sheet which contains all of the data about employees and shifts called "Dictionary" where we enumerate the employees with a value i and shifts with a value j.
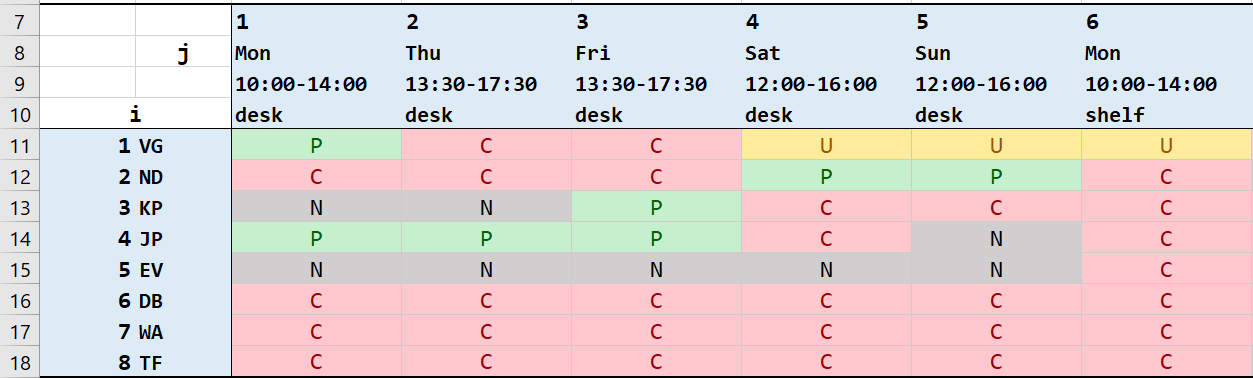
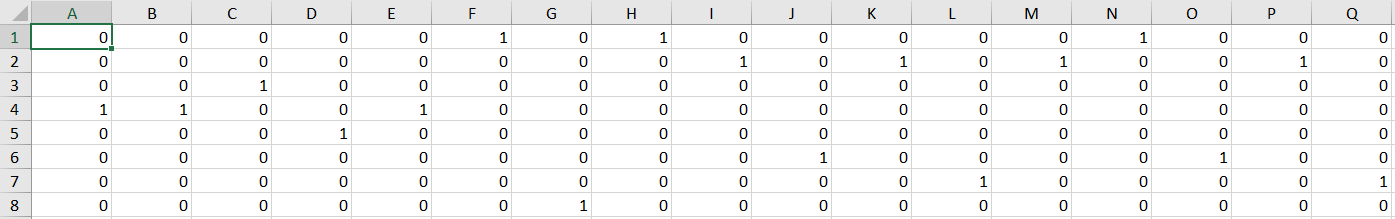
Each employee gives us their availability and preferences. We create an 8x17 preference table in Excel where the entry in the ith row, jth column represents employee i's preference for shift j. The entries are defined as:
Automatically, C is the assumed preference with desk shifts for shelf-exclusive employees and shelf shifts for desk-exclusive employees. Here is a sample of our preference table.
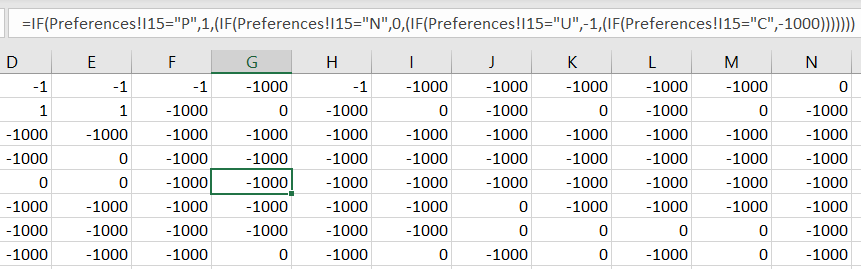
We translate these preferences into numerical scores to be used in the model's objective function.
In general, these values are arbitrary. For now, the important point is that preferred shifts are worth more than neutral shifts which are worth more than unpreferred shifts. Unavailable shifts are very negative as to immediately alert us when the schedule is invalid by inspection of the objective score (defined later). In the future, we may discuss possible uses of changing the relative weight of these scores.
In another sheet, we have the translated score values. These are the values which will be read into Julia.
Now, we use the Taro package to read Excel sheets into Julia DataFrames. We read the staff, shift, and preference score tables.
# get staff, shift, preference tables
staff_df = DataFrame(Taro.readxl("table.xlsx", "Dictionary", staff_key))
shift_df = DataFrame(Taro.readxl("table.xlsx", "Dictionary", shift_key))
pref_df  = DataFrame(Taro.readxl("table.xlsx", "PrefMatrix", pref_key, header = false))
In Julia, we will classify the employees into arrays according to their type (desk/shelf/both). Similarly, we classify the shifts into arrays according to their type and also day of the week. These arrays will make construction of the model constraints easier later on.
Below is an example of employee classification.
# categorize staff by their type
both_staff = Int64[]
desk_staff = Int64[]
shel_staff = Int64[]

for k in 1:size(staff_df,1)
    if staff_df[k,:Type] == "both"
        push!(both_staff,k)
    elseif staff_df[k,:Type] == "desk"
        push!(desk_staff,k)
    else
        push!(shel_staff,k)
    end
end
We will use GLPKSolver for our optimization. Our model will maximize an objective function defined as follows:
# maximize preference score sum
@objective(m, Max, sum(pref_matrix[i,j]*x[i,j] for i in 1:staff, j in 1:shift))
In other words, the solver will produce a schedule which maximizes the sum of the preference scores of assigned employees (called the objective score).
We want as many people as possible to get preferred shifts in order to have a higher objective score.
Next, we convert our preference score table into a preference score matrix and we define a binary assignment matrix. This is the variable to be optimized in the model. Note that staff represents the total number of employees and shift represents the total number of shifts. They are 8 and 17 respectively and can be updated by changing values in the Dictionary sheet.
# staff x shift binary assignment matrix
# 1 if employee i assigned to shift j, 0 otherwise
@variable(m, x[1:staff, 1:shift], Bin)
Continuing, we can now define the hard constraints of our model. A valid schedule cannot violate these constraints. Code for the first and fourth constraint are shown as examples (see GitHub for the rest).
for j in 1:shift
 @constraint(m, sum( x[i,j] for i in 1:staff) == 1)
end
# in the assignment matrix, the sum of each column should be exactly 1
# since each column represents a shift and those assigned to it
for i in 1:staff
 @constraint(m, sum( x[i,j] for j in union(sat_shift,sun_shift)) <= 1)
end
# here we use the category arrays from earlier to construct this constraint easily
# rather than manually enumerating the j-value of sat/sun shifts
Finally, we run the solver and write the results into a DataFrame.
Objective value: 1.0
17×7 DataFrame
│ Row │ Employee │ Name   │ Shift │ Day    │ Time        │ Type   │ Score │
│     │ Int64    │ String │ Int64 │ String │ String      │ String │ Int64 │
├─────┼──────────┼────────┼───────┼────────┼─────────────┼────────┼───────┤
│ 1   │ 1        │ VG     │ 6     │ Mon    │ 10:00-14:00 │ shelf  │ -1    │
│ 2   │ 1        │ VG     │ 8     │ Tue    │ 10:00-14:00 │ shelf  │ -1    │
│ 3   │ 1        │ VG     │ 14    │ Fri    │ 10:00-16:30 │ shelf  │ 0     │
│ 4   │ 2        │ ND     │ 9     │ Tue    │ 16:30-20:30 │ shelf  │ 0     │
│ 5   │ 2        │ ND     │ 11    │ Wed    │ 16:30-20:30 │ shelf  │ 0     │
│ 6   │ 2        │ ND     │ 13    │ Thu    │ 16:30-20:30 │ shelf  │ 0     │
│ 7   │ 2        │ ND     │ 16    │ Sun    │ 10:00-14:00 │ shelf  │ 0     │
│ 8   │ 3        │ KP     │ 3     │ Fri    │ 13:30-17:30 │ desk   │ 1     │
│ 9   │ 4        │ JP     │ 1     │ Mon    │ 10:00-14:00 │ desk   │ 1     │
│ 10  │ 4        │ JP     │ 2     │ Thu    │ 13:30-17:30 │ desk   │ 1     │
│ 11  │ 4        │ JP     │ 5     │ Sun    │ 12:00-16:00 │ desk   │ 0     │
│ 12  │ 5        │ EV     │ 4     │ Sat    │ 12:00-16:00 │ desk   │ 0     │
│ 13  │ 6        │ DB     │ 10    │ Wed    │ 10:00-14:00 │ shelf  │ 0     │
│ 14  │ 6        │ DB     │ 15    │ Sat    │ 10:00-16:30 │ shelf  │ 0     │
│ 15  │ 7        │ WA     │ 12    │ Thu    │ 10:00-14:00 │ shelf  │ 0     │
│ 16  │ 7        │ WA     │ 17    │ Sun    │ 10:00-16:30 │ shelf  │ 0     │
│ 17  │ 8        │ TF     │ 7     │ Mon    │ 16:30-20:30 │ shelf  │ 0     │
We see that a possible optimal schedule (there could be others with objective value 1.0, but certainly none greater) assigns VG to unpreferred shifts. However, most employees are satisfied in general considering our original preference matrix had very few P entries.
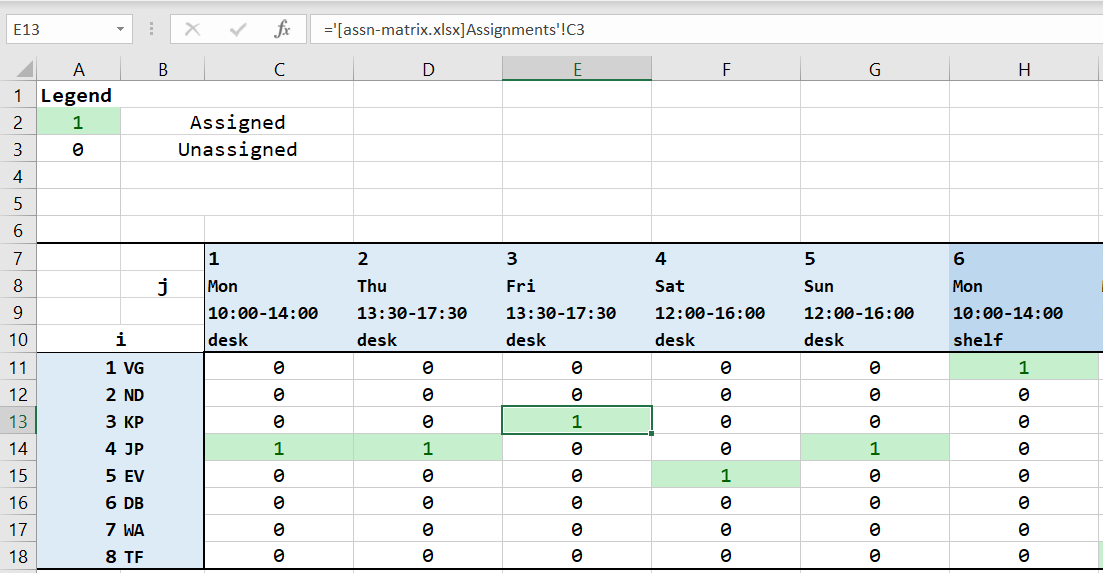
Taro also allows us to write the assignment matrix into an Excel workbook (Note: the assignment matrix is written into a different workbook than the preferences. Anecdotally, writing into an Excel file may wipe or corrupt the file.)
From the original preference workbook, we can read these values from the assignment workbook for a more readable version of the result.